
Observability im Detail: VictoriaMetrics, VictoriaLogs, Grafana
TL;DR Observability basiert auf drei Säulen – Metriken, Logs und Traces – und wird durch die vier …
04.11.2025


Die meisten Website-Betreiber greifen zu Google Analytics oder vergleichbaren SaaS-Lösungen. Das bringt drei fundamentale Probleme:
Dabei enthält jeder Webserver bereits alle Daten, die Sie für aussagekräftige Website-Statistiken brauchen: die Access Logs.
Die Lösung besteht aus drei Komponenten:
nginx (JSON Access Logs)
    |
    v
VictoriaLogs (Log-Aggregation & Indexierung)
    |
    v
Grafana (Dashboards & Visualisierung)
nginx liefert strukturierte JSON-Logs mit allen relevanten Request-Informationen. VictoriaLogs sammelt, indexiert und speichert die Logs. Grafana visualisiert die Daten als Dashboard.
In einer Kubernetes-Umgebung werden die Container-Logs automatisch durch einen Log-Collector (z.B. Vector, Fluent Bit oder den VictoriaLogs Agent) an VictoriaLogs weitergeleitet. Es ist kein zusätzlicher Sidecar oder Log-Shipper im Application Pod erforderlich.
Standard-nginx-Logs im combined-Format sind schwer zu parsen. Strukturierte JSON-Logs lassen sich dagegen automatisch von VictoriaLogs verarbeiten.
nginx.conf)Definieren Sie ein JSON Log-Format im http-Block:
http {
    include       /etc/nginx/mime.types;
    default_type  application/octet-stream;

    log_format json_access escape=json
        '{'
        '"msg":"$request_method $request_uri $status $body_bytes_sent $request_time",'
        '"remote_addr":"$remote_addr",'
        '"http_x_forwarded_for":"$http_x_forwarded_for",'
        '"request_method":"$request_method",'
        '"request_uri":"$request_uri",'
        '"server_protocol":"$server_protocol",'
        '"status":$status,'
        '"body_bytes_sent":$body_bytes_sent,'
        '"http_referer":"$http_referer",'
        '"http_user_agent":"$http_user_agent",'
        '"request_time":$request_time,'
        '"host":"$host"'
        '}';

    access_log /var/log/nginx/access.log json_access;

    sendfile        on;
    keepalive_timeout  65;

    include /etc/nginx/conf.d/*.conf;
}
Wichtig: Das msg-Feld wird von VictoriaLogs als _msg interpretiert – das ist die menschenlesbare Log-Zeile, die in Log-Explorern angezeigt wird.
Wenn Sie nginx in einem Container betreiben, ersetzen Sie die Standard-Konfiguration:
FROM nginx:alpine
COPY nginx.conf /etc/nginx/nginx.conf
COPY default.conf /etc/nginx/conf.d/default.conf
COPY /your-static-site /usr/share/nginx/html
VictoriaLogs ist ein hochperformantes Log-Backend, das JSON-Logs automatisch parst und die Felder indexiert. Es ist deutlich ressourcenschonender als vergleichbare Lösungen wie Elasticsearch oder Loki.
In einem Kubernetes-Cluster deployen Sie VictoriaLogs z.B. via Helm:
helm repo add victoriametrics https://victoriametrics.github.io/helm-charts/
helm install victoria-logs victoriametrics/victoria-logs-single \
  --namespace victoria-logs \
  --create-namespace
Konfigurieren Sie Ihren Log-Collector (z.B. Vector), um Container-Logs an VictoriaLogs weiterzuleiten. Die JSON-Felder werden automatisch als log.*-Felder indexiert:
log.request_uri – die aufgerufene URLlog.status – HTTP Status Codelog.http_user_agent – Browser/Bot-Identifikationlog.http_x_forwarded_for – echte Client-IP (bei Reverse Proxy)log.http_referer – Referrer-URLlog.request_time – Antwortzeit in Sekundenlog.body_bytes_sent – übertragene BytesMit VictoriaLogs als Datasource in Grafana können Sie ein vollständiges Analytics-Dashboard bauen.
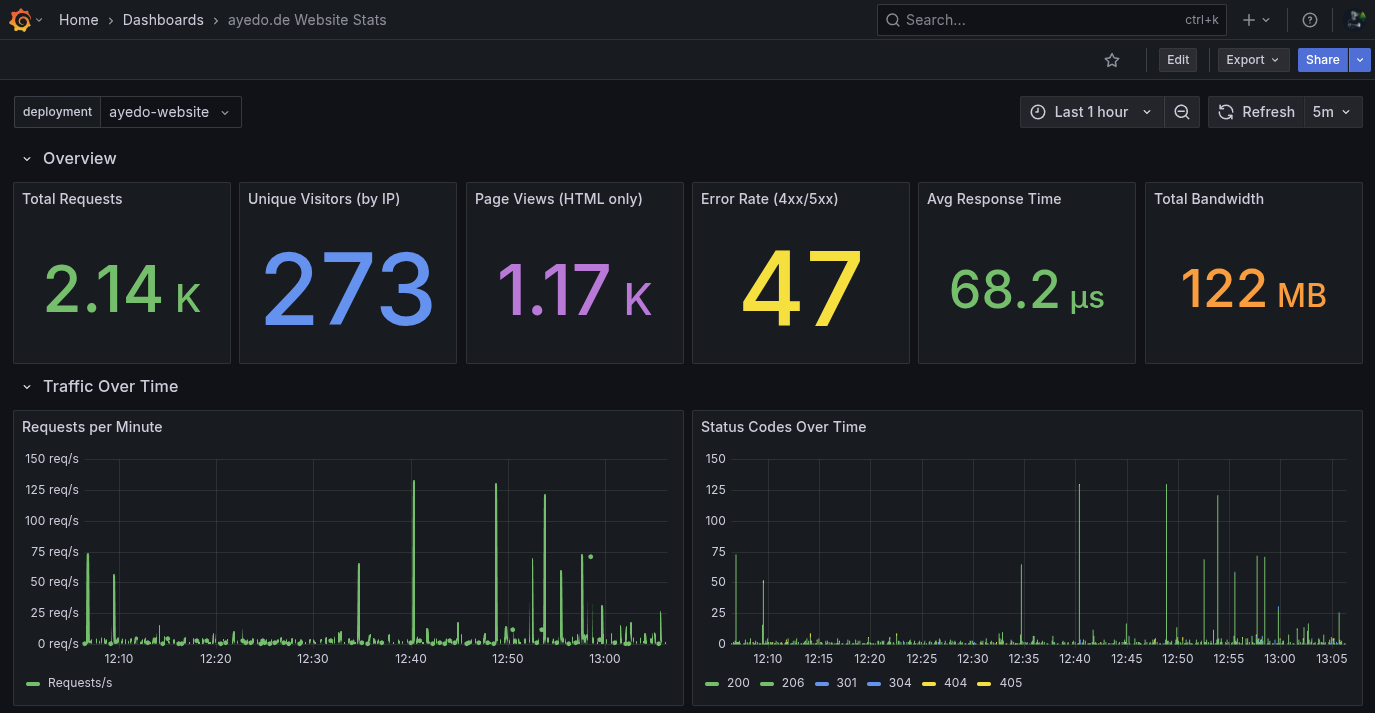
Hier die wichtigsten Panels und ihre LogsQL-Queries:
Alle Queries beginnen mit einem Basis-Filter, der die Logs auf Ihre Applikation einschränkt und Kubernetes Health Checks ausschließt:
kubernetes.pod_namespace:"my-namespace" AND kubernetes.pod_name:my-app* AND NOT log.http_user_agent:kube*
Zählt alle eingehenden Requests (exklusive Health Checks):
kubernetes.pod_namespace:"my-namespace" AND kubernetes.pod_name:my-app* AND NOT log.http_user_agent:kube*
| stats count() total_requests
Zählt eindeutige Besucher-IPs über den X-Forwarded-For-Header:
kubernetes.pod_namespace:"my-namespace" AND kubernetes.pod_name:my-app* AND NOT log.http_user_agent:kube* AND log.http_x_forwarded_for:~".+"
| stats by (log.http_x_forwarded_for) count()
| stats count() unique_visitors
Der Filter log.http_x_forwarded_for:~".+" schließt internen Traffic ohne echte Client-IP aus.
Filtert CSS, JavaScript, Bilder und Fonts heraus – nur echte Seitenaufrufe:
kubernetes.pod_namespace:"my-namespace" AND kubernetes.pod_name:my-app* AND NOT log.http_user_agent:kube* AND NOT log.request_uri:~"\\.(css|js|png|jpg|jpeg|gif|svg|ico|woff|woff2|ttf|eot|mp4|webm|webp)$"
| stats count() page_views
Visualisiert HTTP Status Codes als gestapeltes Balkendiagramm:
kubernetes.pod_namespace:"my-namespace" AND kubernetes.pod_name:my-app* AND NOT log.http_user_agent:kube* AND log.status:*
| stats by (log.status) count() hits
Verwenden Sie {{log.status}} als Legend Format im Grafana Panel.
Die meistbesuchten Seiten als Tabelle:
kubernetes.pod_namespace:"my-namespace" AND kubernetes.pod_name:my-app* AND NOT log.http_user_agent:kube* AND NOT log.request_uri:~"\\.(css|js|png|jpg|jpeg|gif|svg|ico|woff|woff2|ttf|eot|mp4|webm|webp)$"
| stats by (log.request_uri) count() hits
| sort by (hits) desc
| limit 25
Woher kommen Ihre Besucher?
kubernetes.pod_namespace:"my-namespace" AND kubernetes.pod_name:my-app* AND NOT log.http_user_agent:kube* AND log.http_referer:~".+"
| stats by (log.http_referer) count() hits
| sort by (hits) desc
| limit 20
Fehlerhafte Requests überwachen:
kubernetes.pod_namespace:"my-namespace" AND kubernetes.pod_name:my-app* AND NOT log.http_user_agent:kube* AND log.status:~"[45].."
| stats count() errors
Performance im Blick behalten:
kubernetes.pod_namespace:"my-namespace" AND kubernetes.pod_name:my-app* AND NOT log.http_user_agent:kube*
| stats avg(log.request_time) avg_response_time
Das komplette Dashboard als Grafana JSON – importieren Sie es über Dashboards > Import > Paste JSON. Ersetzen Sie YOUR_VICTORIALOGS_DATASOURCE_UID durch die UID Ihrer VictoriaLogs Datasource und passen Sie die Kubernetes-Filter (my-namespace, my-app) an Ihre Umgebung an.
{
  "title": "Website Analytics",
  "tags": ["nginx", "analytics", "victorialogs"],
  "timezone": "browser",
  "editable": true,
  "time": { "from": "now-24h", "to": "now" },
  "refresh": "5m",
  "templating": {
    "list": [
      {
        "name": "namespace",
        "type": "custom",
        "query": "my-namespace",
        "current": { "text": "my-namespace", "value": "my-namespace" },
        "hide": 0
      },
      {
        "name": "app",
        "type": "custom",
        "query": "my-app",
        "current": { "text": "my-app", "value": "my-app" },
        "hide": 0
      }
    ]
  },
  "panels": [
    {
      "collapsed": false,
      "gridPos": { "h": 1, "w": 24, "x": 0, "y": 0 },
      "title": "Overview",
      "type": "row"
    },
    {
      "title": "Total Requests",
      "type": "stat",
      "datasource": { "type": "victoriametrics-logs-datasource", "uid": "YOUR_VICTORIALOGS_DATASOURCE_UID" },
      "gridPos": { "h": 5, "w": 4, "x": 0, "y": 1 },
      "fieldConfig": {
        "defaults": {
          "color": { "mode": "thresholds" },
          "thresholds": { "mode": "absolute", "steps": [{ "color": "green", "value": null }] },
          "unit": "short"
        }
      },
      "options": {
        "colorMode": "value",
        "graphMode": "area",
        "reduceOptions": { "calcs": ["sum"], "fields": "", "values": false }
      },
      "targets": [{
        "expr": "kubernetes.pod_namespace:\"$namespace\" AND kubernetes.pod_name:$app* AND NOT log.http_user_agent:kube*\n| stats count() total_requests",
        "queryType": "stats",
        "refId": "A"
      }]
    },
    {
      "title": "Unique Visitors (by IP)",
      "type": "stat",
      "datasource": { "type": "victoriametrics-logs-datasource", "uid": "YOUR_VICTORIALOGS_DATASOURCE_UID" },
      "gridPos": { "h": 5, "w": 4, "x": 4, "y": 1 },
      "fieldConfig": {
        "defaults": {
          "color": { "mode": "thresholds" },
          "thresholds": { "mode": "absolute", "steps": [{ "color": "blue", "value": null }] },
          "unit": "short"
        }
      },
      "options": {
        "colorMode": "value",
        "graphMode": "none",
        "reduceOptions": { "calcs": ["lastNotNull"], "fields": "", "values": false }
      },
      "targets": [{
        "expr": "kubernetes.pod_namespace:\"$namespace\" AND kubernetes.pod_name:$app* AND NOT log.http_user_agent:kube* AND log.http_x_forwarded_for:~\".+\"\n| stats by (log.http_x_forwarded_for) count()\n| stats count() unique_visitors",
        "queryType": "stats",
        "refId": "A"
      }]
    },
    {
      "title": "Page Views (HTML only)",
      "type": "stat",
      "datasource": { "type": "victoriametrics-logs-datasource", "uid": "YOUR_VICTORIALOGS_DATASOURCE_UID" },
      "gridPos": { "h": 5, "w": 4, "x": 8, "y": 1 },
      "fieldConfig": {
        "defaults": {
          "color": { "mode": "thresholds" },
          "thresholds": { "mode": "absolute", "steps": [{ "color": "purple", "value": null }] },
          "unit": "short"
        }
      },
      "options": {
        "colorMode": "value",
        "graphMode": "area",
        "reduceOptions": { "calcs": ["sum"], "fields": "", "values": false }
      },
      "targets": [{
        "expr": "kubernetes.pod_namespace:\"$namespace\" AND kubernetes.pod_name:$app* AND NOT log.http_user_agent:kube* AND NOT log.request_uri:~\"\\\\.(css|js|png|jpg|jpeg|gif|svg|ico|woff|woff2|ttf|eot|mp4|webm|webp)$\"\n| stats count() page_views",
        "queryType": "stats",
        "refId": "A"
      }]
    },
    {
      "title": "Error Rate (4xx/5xx)",
      "type": "stat",
      "datasource": { "type": "victoriametrics-logs-datasource", "uid": "YOUR_VICTORIALOGS_DATASOURCE_UID" },
      "gridPos": { "h": 5, "w": 4, "x": 12, "y": 1 },
      "fieldConfig": {
        "defaults": {
          "color": { "mode": "thresholds" },
          "thresholds": { "mode": "absolute", "steps": [
            { "color": "green", "value": null },
            { "color": "yellow", "value": 10 },
            { "color": "red", "value": 50 }
          ]},
          "unit": "short"
        }
      },
      "options": {
        "colorMode": "value",
        "graphMode": "area",
        "reduceOptions": { "calcs": ["sum"], "fields": "", "values": false }
      },
      "targets": [{
        "expr": "kubernetes.pod_namespace:\"$namespace\" AND kubernetes.pod_name:$app* AND NOT log.http_user_agent:kube* AND log.status:~\"[45]..\"\n| stats count() errors",
        "queryType": "stats",
        "refId": "A"
      }]
    },
    {
      "title": "Avg Response Time",
      "type": "stat",
      "datasource": { "type": "victoriametrics-logs-datasource", "uid": "YOUR_VICTORIALOGS_DATASOURCE_UID" },
      "gridPos": { "h": 5, "w": 4, "x": 16, "y": 1 },
      "fieldConfig": {
        "defaults": {
          "color": { "mode": "thresholds" },
          "thresholds": { "mode": "absolute", "steps": [
            { "color": "green", "value": null },
            { "color": "yellow", "value": 0.5 },
            { "color": "red", "value": 1 }
          ]},
          "unit": "s"
        }
      },
      "options": {
        "colorMode": "value",
        "graphMode": "none",
        "reduceOptions": { "calcs": ["lastNotNull"], "fields": "", "values": false }
      },
      "targets": [{
        "expr": "kubernetes.pod_namespace:\"$namespace\" AND kubernetes.pod_name:$app* AND NOT log.http_user_agent:kube*\n| stats avg(log.request_time) avg_response_time",
        "queryType": "stats",
        "refId": "A"
      }]
    },
    {
      "title": "Total Bandwidth",
      "type": "stat",
      "datasource": { "type": "victoriametrics-logs-datasource", "uid": "YOUR_VICTORIALOGS_DATASOURCE_UID" },
      "gridPos": { "h": 5, "w": 4, "x": 20, "y": 1 },
      "fieldConfig": {
        "defaults": {
          "color": { "mode": "thresholds" },
          "thresholds": { "mode": "absolute", "steps": [{ "color": "orange", "value": null }] },
          "unit": "decbytes"
        }
      },
      "options": {
        "colorMode": "value",
        "graphMode": "none",
        "reduceOptions": { "calcs": ["lastNotNull"], "fields": "", "values": false }
      },
      "targets": [{
        "expr": "kubernetes.pod_namespace:\"$namespace\" AND kubernetes.pod_name:$app* AND NOT log.http_user_agent:kube*\n| stats sum(log.body_bytes_sent) total_bytes",
        "queryType": "stats",
        "refId": "A"
      }]
    },
    {
      "collapsed": false,
      "gridPos": { "h": 1, "w": 24, "x": 0, "y": 6 },
      "title": "Traffic Over Time",
      "type": "row"
    },
    {
      "title": "Requests per Minute",
      "type": "timeseries",
      "datasource": { "type": "victoriametrics-logs-datasource", "uid": "YOUR_VICTORIALOGS_DATASOURCE_UID" },
      "gridPos": { "h": 8, "w": 12, "x": 0, "y": 7 },
      "fieldConfig": {
        "defaults": {
          "color": { "mode": "palette-classic" },
          "custom": { "drawStyle": "line", "fillOpacity": 20, "lineInterpolation": "smooth", "lineWidth": 2, "showPoints": "never", "spanNulls": false, "stacking": { "mode": "none" } },
          "unit": "reqps"
        }
      },
      "options": {
        "legend": { "displayMode": "list", "placement": "bottom" },
        "tooltip": { "mode": "multi", "sort": "desc" }
      },
      "targets": [{
        "expr": "kubernetes.pod_namespace:\"$namespace\" AND kubernetes.pod_name:$app* AND NOT log.http_user_agent:kube*\n| stats count() requests",
        "legendFormat": "Requests/s",
        "queryType": "statsRange",
        "refId": "A"
      }]
    },
    {
      "title": "Status Codes Over Time",
      "type": "timeseries",
      "datasource": { "type": "victoriametrics-logs-datasource", "uid": "YOUR_VICTORIALOGS_DATASOURCE_UID" },
      "gridPos": { "h": 8, "w": 12, "x": 12, "y": 7 },
      "fieldConfig": {
        "defaults": {
          "color": { "mode": "palette-classic" },
          "custom": { "drawStyle": "bars", "fillOpacity": 80, "lineWidth": 1, "stacking": { "mode": "normal" } },
          "unit": "short"
        },
        "overrides": [
          { "matcher": { "id": "byRegexp", "options": "2.." }, "properties": [{ "id": "color", "value": { "fixedColor": "green", "mode": "fixed" } }] },
          { "matcher": { "id": "byRegexp", "options": "3.." }, "properties": [{ "id": "color", "value": { "fixedColor": "blue", "mode": "fixed" } }] },
          { "matcher": { "id": "byRegexp", "options": "4.." }, "properties": [{ "id": "color", "value": { "fixedColor": "yellow", "mode": "fixed" } }] },
          { "matcher": { "id": "byRegexp", "options": "5.." }, "properties": [{ "id": "color", "value": { "fixedColor": "red", "mode": "fixed" } }] }
        ]
      },
      "options": {
        "legend": { "displayMode": "list", "placement": "bottom" },
        "tooltip": { "mode": "multi", "sort": "desc" }
      },
      "targets": [{
        "expr": "kubernetes.pod_namespace:\"$namespace\" AND kubernetes.pod_name:$app* AND NOT log.http_user_agent:kube* AND log.status:*\n| stats by (log.status) count() hits",
        "legendFormat": "{{log.status}}",
        "queryType": "statsRange",
        "refId": "A"
      }]
    },
    {
      "collapsed": false,
      "gridPos": { "h": 1, "w": 24, "x": 0, "y": 15 },
      "title": "Content Analysis",
      "type": "row"
    },
    {
      "title": "Top Pages",
      "type": "table",
      "datasource": { "type": "victoriametrics-logs-datasource", "uid": "YOUR_VICTORIALOGS_DATASOURCE_UID" },
      "gridPos": { "h": 10, "w": 12, "x": 0, "y": 16 },
      "fieldConfig": {
        "overrides": [{ "matcher": { "id": "byName", "options": "Time" }, "properties": [{ "id": "custom.hidden", "value": true }] }]
      },
      "options": { "cellHeight": "sm", "showHeader": true },
      "targets": [{
        "expr": "kubernetes.pod_namespace:\"$namespace\" AND kubernetes.pod_name:$app* AND NOT log.http_user_agent:kube* AND NOT log.request_uri:~\"\\\\.(css|js|png|jpg|jpeg|gif|svg|ico|woff|woff2|ttf|eot|mp4|webm|webp)$\"\n| stats by (log.request_uri) count() hits\n| sort by (hits) desc\n| limit 25",
        "queryType": "instant",
        "refId": "A"
      }],
      "transformations": [{ "id": "extractFields", "options": { "format": "auto", "keepTime": true, "replace": true, "source": "labels" } }]
    },
    {
      "title": "Top Referrers",
      "type": "table",
      "datasource": { "type": "victoriametrics-logs-datasource", "uid": "YOUR_VICTORIALOGS_DATASOURCE_UID" },
      "gridPos": { "h": 10, "w": 12, "x": 12, "y": 16 },
      "fieldConfig": {
        "overrides": [{ "matcher": { "id": "byName", "options": "Time" }, "properties": [{ "id": "custom.hidden", "value": true }] }]
      },
      "options": { "cellHeight": "sm", "showHeader": true },
      "targets": [{
        "expr": "kubernetes.pod_namespace:\"$namespace\" AND kubernetes.pod_name:$app* AND NOT log.http_user_agent:kube* AND log.http_referer:~\".+\"\n| stats by (log.http_referer) count() hits\n| sort by (hits) desc\n| limit 20",
        "queryType": "instant",
        "refId": "A"
      }],
      "transformations": [{ "id": "extractFields", "options": { "format": "auto", "keepTime": true, "replace": true, "source": "labels" } }]
    },
    {
      "collapsed": false,
      "gridPos": { "h": 1, "w": 24, "x": 0, "y": 26 },
      "title": "Visitors & User Agents",
      "type": "row"
    },
    {
      "title": "Unique Visitors Over Time",
      "type": "timeseries",
      "datasource": { "type": "victoriametrics-logs-datasource", "uid": "YOUR_VICTORIALOGS_DATASOURCE_UID" },
      "gridPos": { "h": 8, "w": 12, "x": 0, "y": 27 },
      "fieldConfig": {
        "defaults": {
          "color": { "fixedColor": "blue", "mode": "fixed" },
          "custom": { "drawStyle": "bars", "fillOpacity": 60, "lineWidth": 1, "stacking": { "mode": "none" } },
          "unit": "short"
        }
      },
      "options": {
        "legend": { "displayMode": "list", "placement": "bottom" },
        "tooltip": { "mode": "single" }
      },
      "targets": [{
        "expr": "kubernetes.pod_namespace:\"$namespace\" AND kubernetes.pod_name:$app* AND NOT log.http_user_agent:kube* AND log.http_x_forwarded_for:~\".+\"\n| stats count_uniq(log.http_x_forwarded_for) unique_visitors",
        "legendFormat": "Unique Visitors",
        "queryType": "statsRange",
        "refId": "A"
      }]
    },
    {
      "title": "Top User Agents",
      "type": "table",
      "datasource": { "type": "victoriametrics-logs-datasource", "uid": "YOUR_VICTORIALOGS_DATASOURCE_UID" },
      "gridPos": { "h": 8, "w": 12, "x": 12, "y": 27 },
      "fieldConfig": {
        "overrides": [{ "matcher": { "id": "byName", "options": "Time" }, "properties": [{ "id": "custom.hidden", "value": true }] }]
      },
      "options": { "cellHeight": "sm", "showHeader": true },
      "targets": [{
        "expr": "kubernetes.pod_namespace:\"$namespace\" AND kubernetes.pod_name:$app* AND NOT log.http_user_agent:kube*\n| stats by (log.http_user_agent) count() hits\n| sort by (hits) desc\n| limit 15",
        "queryType": "instant",
        "refId": "A"
      }],
      "transformations": [{ "id": "extractFields", "options": { "format": "auto", "keepTime": true, "replace": true, "source": "labels" } }]
    },
    {
      "collapsed": false,
      "gridPos": { "h": 1, "w": 24, "x": 0, "y": 35 },
      "title": "Errors & Performance",
      "type": "row"
    },
    {
      "title": "404 Not Found Pages",
      "type": "table",
      "datasource": { "type": "victoriametrics-logs-datasource", "uid": "YOUR_VICTORIALOGS_DATASOURCE_UID" },
      "gridPos": { "h": 8, "w": 12, "x": 0, "y": 36 },
      "fieldConfig": {
        "overrides": [{ "matcher": { "id": "byName", "options": "Time" }, "properties": [{ "id": "custom.hidden", "value": true }] }]
      },
      "options": { "cellHeight": "sm", "showHeader": true },
      "targets": [{
        "expr": "kubernetes.pod_namespace:\"$namespace\" AND kubernetes.pod_name:$app* AND log.status:404\n| stats by (log.request_uri) count() hits\n| sort by (hits) desc\n| limit 20",
        "queryType": "instant",
        "refId": "A"
      }],
      "transformations": [{ "id": "extractFields", "options": { "format": "auto", "keepTime": true, "replace": true, "source": "labels" } }]
    },
    {
      "title": "Response Time Over Time",
      "type": "timeseries",
      "datasource": { "type": "victoriametrics-logs-datasource", "uid": "YOUR_VICTORIALOGS_DATASOURCE_UID" },
      "gridPos": { "h": 8, "w": 12, "x": 12, "y": 36 },
      "fieldConfig": {
        "defaults": {
          "color": { "mode": "palette-classic" },
          "custom": { "drawStyle": "line", "fillOpacity": 10, "lineInterpolation": "smooth", "lineWidth": 2, "showPoints": "never", "spanNulls": false, "stacking": { "mode": "none" } },
          "unit": "s"
        }
      },
      "options": {
        "legend": { "displayMode": "list", "placement": "bottom" },
        "tooltip": { "mode": "multi", "sort": "desc" }
      },
      "targets": [{
        "expr": "kubernetes.pod_namespace:\"$namespace\" AND kubernetes.pod_name:$app* AND NOT log.http_user_agent:kube*\n| stats avg(log.request_time) avg_time, max(log.request_time) max_time",
        "legendFormat": "{{__name__}}",
        "queryType": "statsRange",
        "refId": "A"
      }]
    },
    {
      "collapsed": false,
      "gridPos": { "h": 1, "w": 24, "x": 0, "y": 44 },
      "title": "Raw Access Logs",
      "type": "row"
    },
    {
      "title": "Access Logs",
      "type": "logs",
      "datasource": { "type": "victoriametrics-logs-datasource", "uid": "YOUR_VICTORIALOGS_DATASOURCE_UID" },
      "gridPos": { "h": 12, "w": 24, "x": 0, "y": 45 },
      "options": {
        "dedupStrategy": "none",
        "enableLogDetails": true,
        "showLabels": true,
        "showTime": true,
        "sortOrder": "Descending",
        "wrapLogMessage": false
      },
      "targets": [{
        "expr": "kubernetes.pod_namespace:\"$namespace\" AND kubernetes.pod_name:$app*\n| sort by (_time)\n| limit 200",
        "queryType": "instant",
        "refId": "A"
      }]
    }
  ]
}
Warum ist diese Lösung DSGVO-konform?
Empfehlung: Anonymisieren oder kürzen Sie die IP-Adressen in den Logs, wenn Sie auch die letzten rechtlichen Graubereiche ausschließen möchten. Dies kann direkt in der nginx-Konfiguration oder durch eine VictoriaLogs Retention Policy erfolgen.
| Kriterium | SaaS Analytics (z.B. GA) | nginx + VictoriaLogs + Grafana |
|---|---|---|
| DSGVO | Cookie-Banner + Einwilligung | Kein Banner nötig |
| Datenspeicherort | USA / Drittanbieter | Eigene Infrastruktur |
| Kosten | Oft nutzungsabhängig | Fixkosten (Infrastruktur) |
| Anpassbarkeit | Eingeschränkt | Volle Kontrolle über Queries |
| Performance-Daten | Eingeschränkt | Response Times, Error Rates |
| Bot-Erkennung | Integriert | Über User-Agent Filter |
| Real-Time | Minuten Verzögerung | Sekunden |
Sie möchten diese Lösung nutzen, ohne den gesamten Stack selbst zu betreiben? ayedo bietet alle Komponenten als Managed Service:
Der gesamte Observability-Stack wird von ayedo betrieben, überwacht und aktualisiert. Sie konzentrieren sich auf Ihre Applikation – wir kümmern uns um die Infrastruktur.
Kontaktieren Sie uns für eine individuelle Beratung.
ayedo betreibt Kubernetes-basierte Infrastruktur für Unternehmen, die Wert auf digitale Souveränität, Compliance und operative Exzellenz legen. Mehr erfahren
TL;DR Observability basiert auf drei Säulen – Metriken, Logs und Traces – und wird durch die vier …

TL;DR Moderne Compliance-Anforderungen wie NIS-2, DORA und GDPR verlangen eine belastbare, …

Wer Anwendungen produktiv betreibt, braucht keine schönen Dashboards, sondern harte Daten. …