
S3 Object Storage in the European Legal Framework: Securing Data Sovereignty
Data is the most valuable asset of modern companies—and simultaneously their greatest regulatory …
22.06.2026

Most website operators reach for Google Analytics or similar SaaS solutions. This creates three fundamental problems:
Yet every web server already contains all the data you need for meaningful website statistics: the access logs.
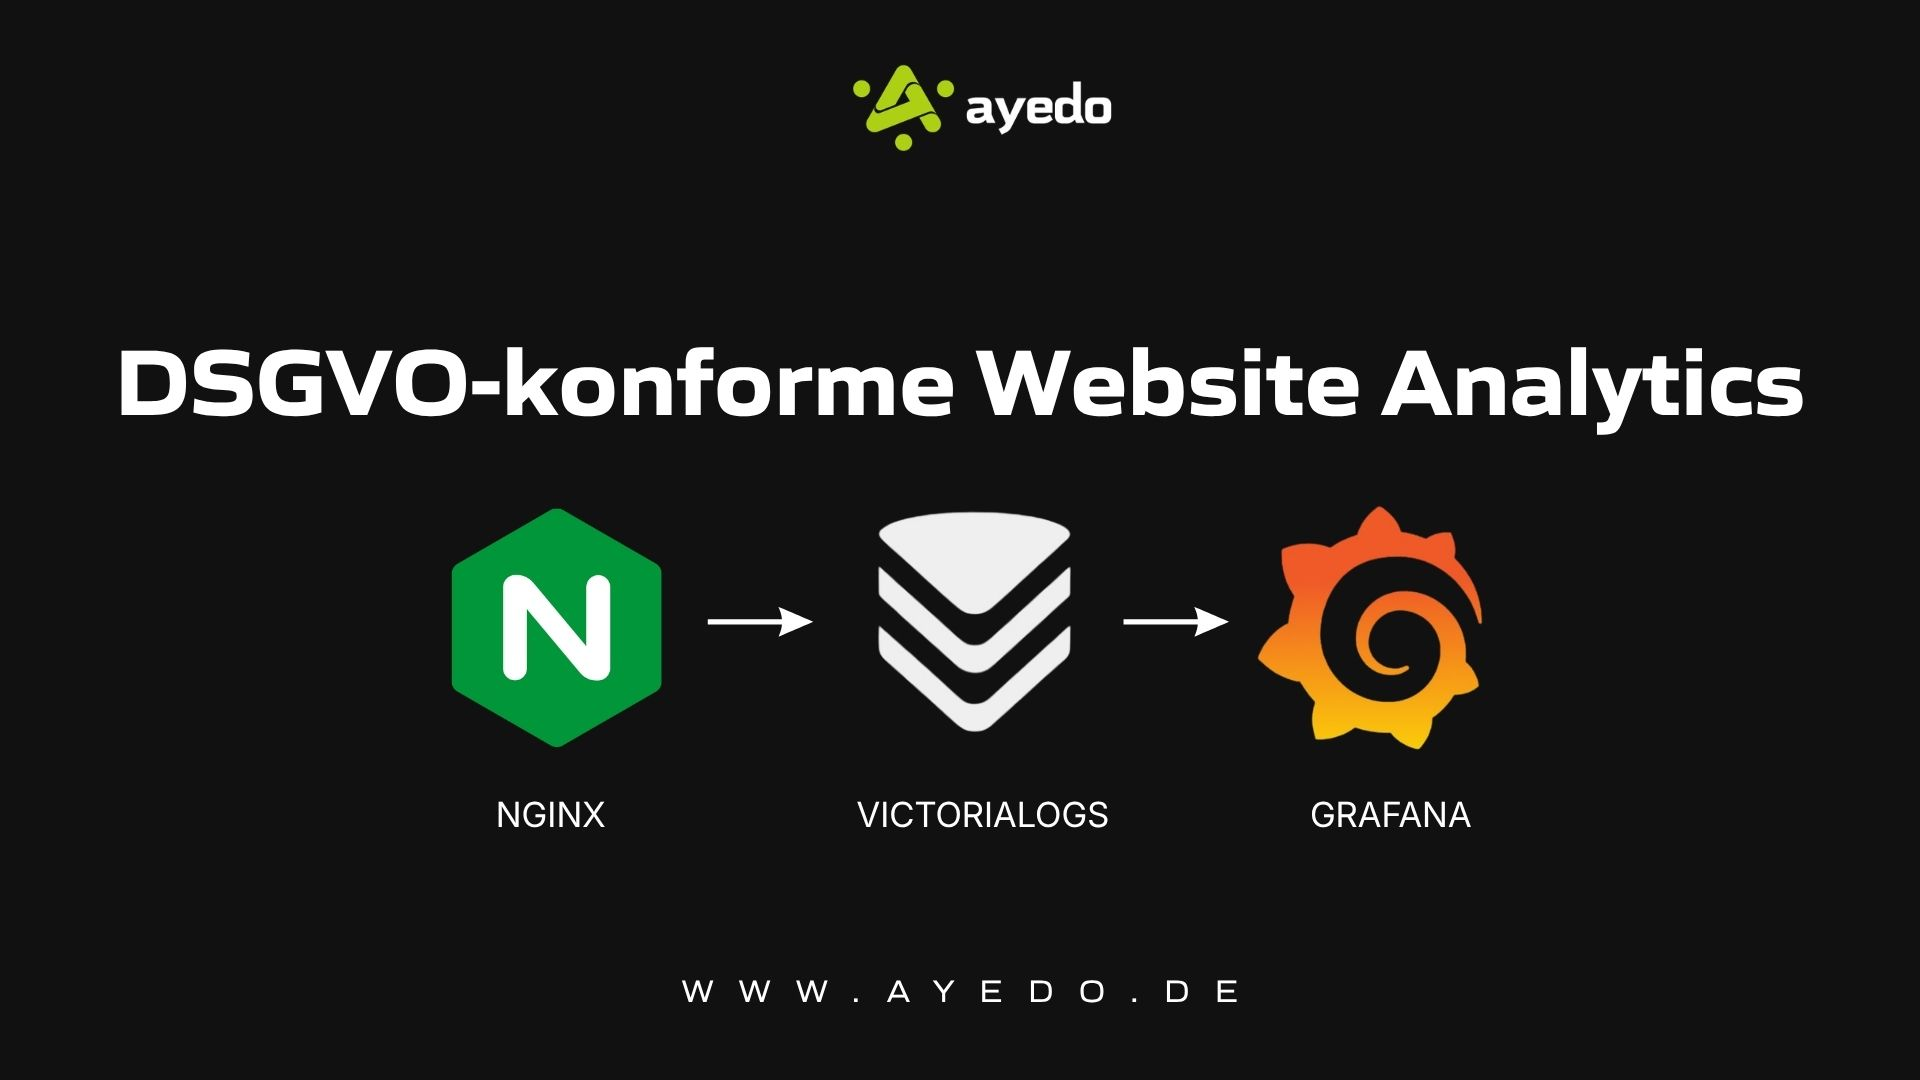
The solution consists of three components:
nginx (JSON Access Logs)
    |
    v
VictoriaLogs (Log Aggregation & Indexing)
    |
    v
Grafana (Dashboards & Visualization)
nginx delivers structured JSON logs with all relevant request information. VictoriaLogs collects, indexes and stores the logs. Grafana visualizes the data as dashboards.
In a Kubernetes environment, container logs are automatically forwarded to VictoriaLogs by a log collector (e.g. Vector, Fluent Bit or the VictoriaLogs Agent). No additional sidecar or log shipper is required in the application pod.
Standard nginx logs in combined format are difficult to parse. Structured JSON logs, on the other hand, are automatically processed by VictoriaLogs.
nginx.conf)Define a JSON log format in the http block:
http {
    include       /etc/nginx/mime.types;
    default_type  application/octet-stream;

    log_format json_access escape=json
        '{'
        '"msg":"$request_method $request_uri $status $body_bytes_sent $request_time",'
        '"remote_addr":"$remote_addr",'
        '"http_x_forwarded_for":"$http_x_forwarded_for",'
        '"request_method":"$request_method",'
        '"request_uri":"$request_uri",'
        '"server_protocol":"$server_protocol",'
        '"status":$status,'
        '"body_bytes_sent":$body_bytes_sent,'
        '"http_referer":"$http_referer",'
        '"http_user_agent":"$http_user_agent",'
        '"request_time":$request_time,'
        '"host":"$host"'
        '}';

    access_log /var/log/nginx/access.log json_access;

    sendfile        on;
    keepalive_timeout  65;

    include /etc/nginx/conf.d/*.conf;
}Important: The msg field is interpreted by VictoriaLogs as _msg – this is the human-readable log line displayed in log explorers.
If you run nginx in a container, replace the default configuration:
FROM nginx:alpine
COPY nginx.conf /etc/nginx/nginx.conf
COPY default.conf /etc/nginx/conf.d/default.conf
COPY /your-static-site /usr/share/nginx/htmlVictoriaLogs is a high-performance log backend that automatically parses JSON logs and indexes the fields. It is significantly more resource-efficient than comparable solutions like Elasticsearch or Loki.
In a Kubernetes cluster, deploy VictoriaLogs via Helm:
helm repo add victoriametrics https://victoriametrics.github.io/helm-charts/
helm install victoria-logs victoriametrics/victoria-logs-single \
  --namespace victoria-logs \
--create-namespaceConfigure your log collector (e.g. Vector) to forward container logs to VictoriaLogs. The JSON fields are automatically indexed as log.* fields:
log.request_uri – the requested URLlog.status – HTTP status codelog.http_user_agent – browser/bot identificationlog.http_x_forwarded_for – real client IP (behind reverse proxy)log.http_referer – referrer URLlog.request_time – response time in secondslog.body_bytes_sent – transferred bytesWith VictoriaLogs as a datasource in Grafana, you can build a complete analytics dashboard.
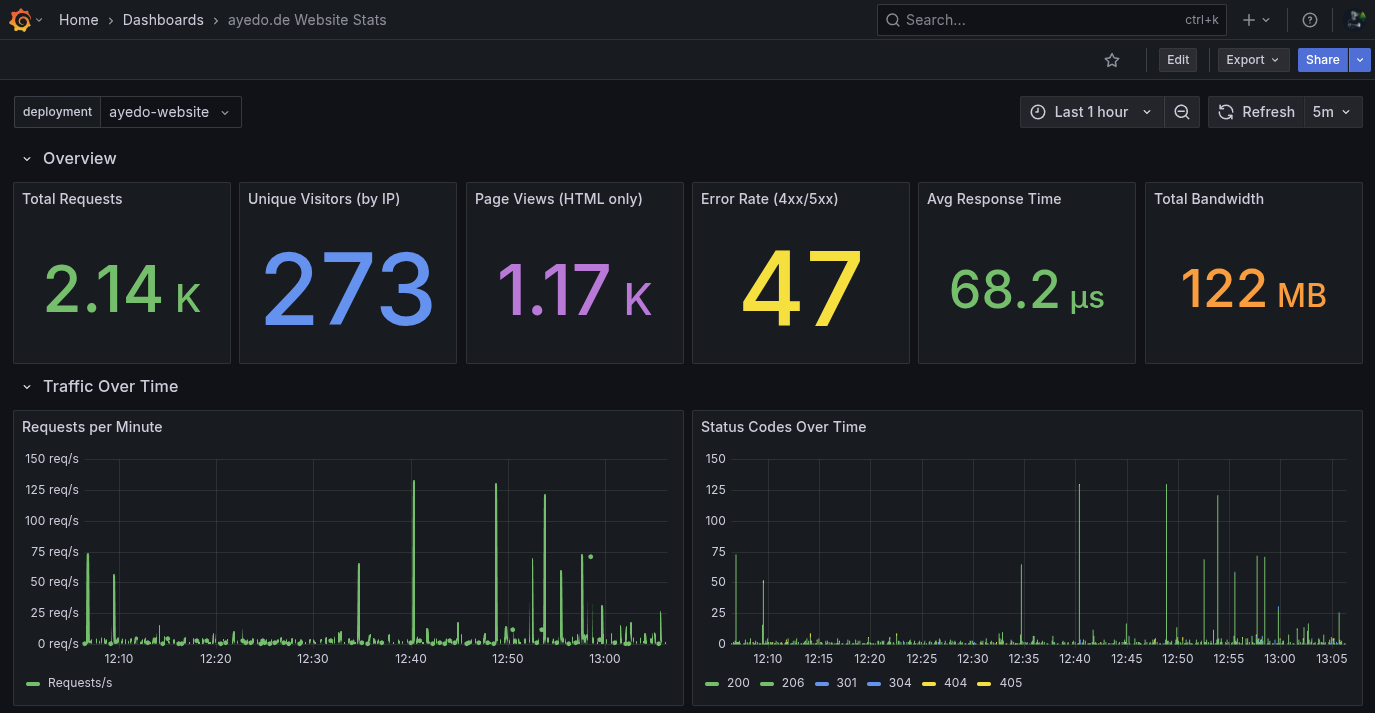
Here are the key panels and their LogsQL queries:
All queries start with a base filter that scopes logs to your application and excludes Kubernetes health checks:
kubernetes.pod_namespace:"my-namespace" AND kubernetes.pod_name:my-app* AND NOT log.http_user_agent:kube*Count all incoming requests (excluding health checks):
kubernetes.pod_namespace:"my-namespace" AND kubernetes.pod_name:my-app* AND NOT log.http_user_agent:kube*
| stats count() total_requestsCount unique visitor IPs via the X-Forwarded-For header:
kubernetes.pod_namespace:"my-namespace" AND kubernetes.pod_name:my-app* AND NOT log.http_user_agent:kube* AND log.http_x_forwarded_for:~".+"
| stats by (log.http_x_forwarded_for) count()
| stats count() unique_visitors
The filter log.http_x_forwarded_for:~".+" excludes internal traffic without a real client IP.
Filter out CSS, JavaScript, images and fonts – only real page views:
kubernetes.pod_namespace:"my-namespace" AND kubernetes.pod_name:my-app* AND NOT log.http_user_agent:kube* AND NOT log.request_uri:~"\\.(css|js|png|jpg|jpeg|gif|svg|ico|woff|woff2|ttf|eot|mp4|webm|webp)$"
| stats count() page_viewsVisualize HTTP status codes as a stacked bar chart:
kubernetes.pod_namespace:"my-namespace" AND kubernetes.pod_name:my-app* AND NOT log.http_user_agent:kube* AND log.status:*
| stats by (log.status) count() hits
Use {{log.status}} as the Legend Format in the Grafana panel.
Most visited pages as a table:
kubernetes.pod_namespace:"my-namespace" AND kubernetes.pod_name:my-app* AND NOT log.http_user_agent:kube* AND NOT log.request_uri:~"\\.(css|js|png|jpg|jpeg|gif|svg|ico|woff|woff2|ttf|eot|mp4|webm|webp)$"
| stats by (log.request_uri) count() hits
| sort by (hits) desc
| limit 25Where do your visitors come from?
kubernetes.pod_namespace:"my-namespace" AND kubernetes.pod_name:my-app* AND NOT log.http_user_agent:kube* AND log.http_referer:~".+"
| stats by (log.http_referer) count() hits
| sort by (hits) desc
| limit 20Monitor failed requests:
kubernetes.pod_namespace:"my-namespace" AND kubernetes.pod_name:my-app* AND NOT log.http_user_agent:kube* AND log.status:~"[45].."
| stats count() errorsKeep performance in check:
kubernetes.pod_namespace:"my-namespace" AND kubernetes.pod_name:my-app* AND NOT log.http_user_agent:kube*
| stats avg(log.request_time) avg_response_timeThe complete dashboard as Grafana JSON – import it via Dashboards > Import > Paste JSON. Replace YOUR_VICTORIALOGS_DATASOURCE_UID with your VictoriaLogs datasource UID and adjust the Kubernetes filters (my-namespace, my-app) to match your environment.
{
  "title": "Website Analytics",
  "tags": ["nginx", "analytics", "victorialogs"],
  "timezone": "browser",
  "editable": true,
  "time": { "from": "now-24h", "to": "now" },
  "refresh": "5m",
  "templating": {
    "list": [
      {
        "name": "namespace",
        "type": "custom",
        "query": "my-namespace",
        "current": { "text": "my-namespace", "value": "my-namespace" },
        "hide": 0
      },
      {
        "name": "app",
        "type": "custom",
        "query": "my-app",
        "current": { "text": "my-app", "value": "my-app" },
        "hide": 0
      }
    ]
  },
  "panels": [
    {
      "collapsed": false,
      "gridPos": { "h": 1, "w": 24, "x": 0, "y": 0 },
      "title": "Overview",
      "type": "row"
    },
    {
      "title": "Total Requests",
      "type": "stat",
      "datasource": { "type": "victoriametrics-logs-datasource", "uid": "YOUR_VICTORIALOGS_DATASOURCE_UID" },
      "gridPos": { "h": 5, "w": 4, "x": 0, "y": 1 },
      "fieldConfig": {
        "defaults": {
          "color": { "mode": "thresholds" },
          "thresholds": { "mode": "absolute", "steps": [{ "color": "green", "value": null }] },
          "unit": "short"
        }
      },
      "options": {
        "colorMode": "value",
        "graphMode": "area",
        "reduceOptions": { "calcs": ["sum"], "fields": "", "values": false }
      },
      "targets": [{
        "expr": "kubernetes.pod_namespace:\"$namespace\" AND kubernetes.pod_name:$app* AND NOT log.http_user_agent:kube*\n| stats count() total_requests",
        "queryType": "stats",
        "refId": "A"
      }]
    },
    {
      "title": "Unique Visitors (by IP)",
      "type": "stat",
      "datasource": { "type": "victoriametrics-logs-datasource", "uid": "YOUR_VICTORIALOGS_DATASOURCE_UID" },
      "gridPos": { "h": 5, "w": 4, "x": 4, "y": 1 },
      "fieldConfig": {
        "defaults": {
          "color": { "mode": "thresholds" },
          "thresholds": { "mode": "absolute", "steps": [{ "color": "blue", "value": null }] },
          "unit": "short"
        }
      },
      "options": {
        "colorMode": "value",
        "graphMode": "none",
        "reduceOptions": { "calcs": ["lastNotNull"], "fields": "", "values": false }
      },
      "targets": [{
        "expr": "kubernetes.pod_namespace:\"$namespace\" AND kubernetes.pod_name:$app* AND NOT log.http_user_agent:kube* AND log.http_x_forwarded_for:~\".+\"\n| stats by (log.http_x_forwarded_for) count()\n| stats count() unique_visitors",
        "queryType": "stats",
        "refId": "A"
      }]
    },
    {
      "title": "Page Views (HTML only)",
      "type": "stat",
      "datasource": { "type": "victoriametrics-logs-datasource", "uid": "YOUR_VICTORIALOGS_DATASOURCE_UID" },
      "gridPos": { "h": 5, "w": 4, "x": 8, "y": 1 },
      "fieldConfig": {
        "defaults": {
          "color": { "mode": "thresholds" },
          "thresholds": { "mode": "absolute", "steps": [{ "color": "purple", "value": null }] },
          "unit": "short"
        }
      },
      "options": {
        "colorMode": "value",
        "graphMode": "area",
        "reduceOptions": { "calcs": ["sum"], "fields": "", "values": false }
      },
      "targets": [{
        "expr": "kubernetes.pod_namespace:\"$namespace\" AND kubernetes.pod_name:$app* AND NOT log.http_user_agent:kube* AND NOT log.request_uri:~\"\\\\.(css|js|png|jpg|jpeg|gif|svg|ico|woff|woff2|ttf|eot|mp4|webm|webp)$\"\n| stats count() page_views",
        "queryType": "stats",
        "refId": "A"
      }]
    },
    {
      "title": "Error Rate (4xx/5xx)",
      "type": "stat",
      "datasource": { "type": "victoriametrics-logs-datasource", "uid": "YOUR_VICTORIALOGS_DATASOURCE_UID" },
      "gridPos": { "h": 5, "w": 4, "x": 12, "y": 1 },
      "fieldConfig": {
        "defaults": {
          "color": { "mode": "thresholds" },
          "thresholds": { "mode": "absolute", "steps": [
            { "color": "green", "value": null },
            { "color": "yellow", "value": 10 },
            { "color": "red", "value": 50 }
          ]},
          "unit": "short"
        }
      },
      "options": {
        "colorMode": "value",
        "graphMode": "area",
        "reduceOptions": { "calcs": ["sum"], "fields": "", "values": false }
      },
      "targets": [{
        "expr": "kubernetes.pod_namespace:\"$namespace\" AND kubernetes.pod_name:$app* AND NOT log.http_user_agent:kube* AND log.status:~\"[45]..\"\n| stats count() errors",
        "queryType": "stats",
        "refId": "A"
      }]
    },
    {
      "title": "Avg Response Time",
      "type": "stat",
      "datasource": { "type": "victoriametrics-logs-datasource", "uid": "YOUR_VICTORIALOGS_DATASOURCE_UID" },
      "gridPos": { "h": 5, "w": 4, "x": 16, "y": 1 },
      "fieldConfig": {
        "defaults": {
          "color": { "mode": "thresholds" },
          "thresholds": { "mode": "absolute", "steps": [
            { "color": "green", "value": null },
            { "color": "yellow", "value": 0.5 },
            { "color": "red", "value": 1 }
          ]},
          "unit": "s"
        }
      },
      "options": {
        "colorMode": "value",
        "graphMode": "none",
        "reduceOptions": { "calcs": ["lastNotNull"], "fields": "", "values": false }
      },
      "targets": [{
        "expr": "kubernetes.pod_namespace:\"$namespace\" AND kubernetes.pod_name:$app* AND NOT log.http_user_agent:kube*\n| stats avg(log.request_time) avg_response_time",
        "queryType": "stats",
        "refId": "A"
      }]
    },
    {
      "title": "Total Bandwidth",
      "type": "stat",
      "datasource": { "type": "victoriametrics-logs-datasource", "uid": "YOUR_VICTORIALOGS_DATASOURCE_UID" },
      "gridPos": { "h": 5, "w": 4, "x": 20, "y": 1 },
      "fieldConfig": {
        "defaults": {
          "color": { "mode": "thresholds" },
          "thresholds": { "mode": "absolute", "steps": [{ "color": "orange", "value": null }] },
          "unit": "decbytes"
        }
      },
      "options": {
        "colorMode": "value",
        "graphMode": "none",
        "reduceOptions": { "calcs": ["lastNotNull"], "fields": "", "values": false }
      },
      "targets": [{
        "expr": "kubernetes.pod_namespace:\"$namespace\" AND kubernetes.pod_name:$app* AND NOT log.http_user_agent:kube*\n| stats sum(log.body_bytes_sent) total_bytes",
        "queryType": "stats",
        "refId": "A"
      }]
    },
    {
      "collapsed": false,
      "gridPos": { "h": 1, "w": 24, "x": 0, "y": 6 },
      "title": "Traffic Over Time",
      "type": "row"
    },
    {
      "title": "Requests per Minute",
      "type": "timeseries",
      "datasource": { "type": "victoriametrics-logs-datasource", "uid": "YOUR_VICTORIALOGS_DATASOURCE_UID" },
      "gridPos": { "h": 8, "w": 12, "x": 0, "y": 7 },
      "fieldConfig": {
        "defaults": {
          "color": { "mode": "palette-classic" },
          "custom": { "drawStyle": "line", "fillOpacity": 20, "lineInterpolation": "smooth", "lineWidth": 2, "showPoints": "never", "spanNulls": false, "stacking": { "mode": "none" } },
          "unit": "reqps"
        }
      },
      "options": {
        "legend": { "displayMode": "list", "placement": "bottom" },
        "tooltip": { "mode": "multi", "sort": "desc" }
      },
      "targets": [{
        "expr": "kubernetes.pod_namespace:\"$namespace\" AND kubernetes.pod_name:$app* AND NOT log.http_user_agent:kube*\n| stats count() requests",
        "legendFormat": "Requests/s",
        "queryType": "statsRange",
        "refId": "A"
      }]
    },
    {
      "title": "Status Codes Over Time",
      "type": "timeseries",
      "datasource": { "type": "victoriametrics-logs-datasource", "uid": "YOUR_VICTORIALOGS_DATASOURCE_UID" },
      "gridPos": { "h": 8, "w": 12, "x": 12, "y": 7 },
      "fieldConfig": {
        "defaults": {
          "color": { "mode": "palette-classic" },
          "custom": { "drawStyle": "bars", "fillOpacity": 80, "lineWidth": 1, "stacking": { "mode": "normal" } },
          "unit": "short"
        },
        "overrides": [
          { "matcher": { "id": "byRegexp", "options": "2.." }, "properties": [{ "id": "color", "value": { "fixedColor": "green", "mode": "fixed" } }] },
          { "matcher": { "id": "byRegexp", "options": "3.." }, "properties": [{ "id": "color", "value": { "fixedColor": "blue", "mode": "fixed" } }] },
          { "matcher": { "id": "byRegexp", "options": "4.." }, "properties": [{ "id": "color", "value": { "fixedColor": "yellow", "mode": "fixed" } }] },
          { "matcher": { "id": "byRegexp", "options": "5.." }, "properties": [{ "id": "color", "value": { "fixedColor": "red", "mode": "fixed" } }] }
        ]
      },
      "options": {
        "legend": { "displayMode": "list", "placement": "bottom" },
        "tooltip": { "mode": "multi", "sort": "desc" }
      },
      "targets": [{
        "expr": "kubernetes.pod_namespace:\"$namespace\" AND kubernetes.pod_name:$app* AND NOT log.http_user_agent:kube* AND log.status:*\n| stats by (log.status) count() hits",
        "legendFormat": "{{log.status}}",
        "queryType": "statsRange",
        "refId": "A"
      }]
    },
    {
      "collapsed": false,
      "gridPos": { "h": 1, "w": 24, "x": 0, "y": 15 },
      "title": "Content Analysis",
      "type": "row"
    },
    {
      "title": "Top Pages",
      "type": "table",
      "datasource": { "type": "victoriametrics-logs-datasource", "uid": "YOUR_VICTORIALOGS_DATASOURCE_UID" },
      "gridPos": { "h": 10, "w": 12, "x": 0, "y": 16 },
      "fieldConfig": {
        "overrides": [{ "matcher": { "id": "byName", "options": "Time" }, "properties": [{ "id": "custom.hidden", "value": true }] }]
      },
      "options": { "cellHeight": "sm", "showHeader": true },
      "targets": [{
        "expr": "kubernetes.pod_namespace:\"$namespace\" AND kubernetes.pod_name:$app* AND NOT log.http_user_agent:kube* AND NOT log.request_uri:~\"\\\\.(css|js|png|jpg|jpeg|gif|svg|ico|woff|woff2|ttf|eot|mp4|webm|webp)$\"\n| stats by (log.request_uri) count() hits\n| sort by (hits) desc\n| limit 25",
        "queryType": "instant",
        "refId": "A"
      }],
      "transformations": [{ "id": "extractFields", "options": { "format": "auto", "keepTime": true, "replace": true, "source": "labels" } }]
    },
    {
      "title": "Top Referrers",
      "type": "table",
      "datasource": { "type": "victoriametrics-logs-datasource", "uid": "YOUR_VICTORIALOGS_DATASOURCE_UID" },
      "gridPos": { "h": 10, "w": 12, "x": 12, "y": 16 },
      "fieldConfig": {
        "overrides": [{ "matcher": { "id": "byName", "options": "Time" }, "properties": [{ "id": "custom.hidden", "value": true }] }]
      },
      "options": { "cellHeight": "sm", "showHeader": true },
      "targets": [{
        "expr": "kubernetes.pod_namespace:\"$namespace\" AND kubernetes.pod_name:$app* AND NOT log.http_user_agent:kube* AND log.http_referer:~\".+\"\n| stats by (log.http_referer) count() hits\n| sort by (hits) desc\n| limit 20",
        "queryType": "instant",
        "refId": "A"
      }],
      "transformations": [{ "id": "extractFields", "options": { "format": "auto", "keepTime": true, "replace": true, "source": "labels" } }]
    },
    {
      "collapsed": false,
      "gridPos": { "h": 1, "w": 24, "x": 0, "y": 26 },
      "title": "Visitors & User Agents",
      "type": "row"
    },
    {
      "title": "Unique Visitors Over Time",
      "type": "timeseries",
      "datasource": { "type": "victoriametrics-logs-datasource", "uid": "YOUR_VICTORIALOGS_DATASOURCE_UID" },
      "gridPos": { "h": 8, "w": 12, "x": 0, "y": 27 },
      "fieldConfig": {
        "defaults": {
          "color": { "fixedColor": "blue", "mode": "fixed" },
          "custom": { "drawStyle": "bars", "fillOpacity": 60, "lineWidth": 1, "stacking": { "mode": "none" } },
          "unit": "short"
        }
      },
      "options": {
        "legend": { "displayMode": "list", "placement": "bottom" },
        "tooltip": { "mode": "single" }
      },
      "targets": [{
        "expr": "kubernetes.pod_namespace:\"$namespace\" AND kubernetes.pod_name:$app* AND NOT log.http_user_agent:kube* AND log.http_x_forwarded_for:~\".+\"\n| stats count_uniq(log.http_x_forwarded_for) unique_visitors",
        "legendFormat": "Unique Visitors",
        "queryType": "statsRange",
        "refId": "A"
      }]
    },
    {
      "title": "Top User Agents",
      "type": "table",
      "datasource": { "type": "victoriametrics-logs-datasource", "uid": "YOUR_VICTORIALOGS_DATASOURCE_UID" },
      "gridPos": { "h": 8, "w": 12, "x": 12, "y": 27 },
      "fieldConfig": {
        "overrides": [{ "matcher": { "id": "byName", "options": "Time" }, "properties": [{ "id": "custom.hidden", "value": true }] }]
      },
      "options": { "cellHeight": "sm", "showHeader": true },
      "targets": [{
        "expr": "kubernetes.pod_namespace:\"$namespace\" AND kubernetes.pod_name:$app* AND NOT log.http_user_agent:kube*\n| stats by (log.http_user_agent) count() hits\n| sort by (hits) desc\n| limit 15",
        "queryType": "instant",
        "refId": "A"
      }],
      "transformations": [{ "id": "extractFields", "options": { "format": "auto", "keepTime": true, "replace": true, "source": "labels" } }]
    },
    {
      "collapsed": false,
      "gridPos": { "h": 1, "w": 24, "x": 0, "y": 35 },
      "title": "Errors & Performance",
      "type": "row"
    },
    {
      "title": "404 Not Found Pages",
      "type": "table",
      "datasource": { "type": "victoriametrics-logs-datasource", "uid": "YOUR_VICTORIALOGS_DATASOURCE_UID" },
      "gridPos": { "h": 8, "w": 12, "x": 0, "y": 36 },
      "fieldConfig": {
        "overrides": [{ "matcher": { "id": "byName", "options": "Time" }, "properties": [{ "id": "custom.hidden", "value": true }] }]
      },
      "options": { "cellHeight": "sm", "showHeader": true },
      "targets": [{
        "expr": "kubernetes.pod_namespace:\"$namespace\" AND kubernetes.pod_name:$app* AND log.status:404\n| stats by (log.request_uri) count() hits\n| sort by (hits) desc\n| limit 20",
        "queryType": "instant",
        "refId": "A"
      }],
      "transformations": [{ "id": "extractFields", "options": { "format": "auto", "keepTime": true, "replace": true, "source": "labels" } }]
    },
    {
      "title": "Response Time Over Time",
      "type": "timeseries",
      "datasource": { "type": "victoriametrics-logs-datasource", "uid": "YOUR_VICTORIALOGS_DATASOURCE_UID" },
      "gridPos": { "h": 8, "w": 12, "x": 12, "y": 36 },
      "fieldConfig": {
        "defaults": {
          "color": { "mode": "palette-classic" },
          "custom": { "drawStyle": "line", "fillOpacity": 10, "lineInterpolation": "smooth", "lineWidth": 2, "showPoints": "never", "spanNulls": false, "stacking": { "mode": "none" } },
          "unit": "s"
        }
      },
      "options": {
        "legend": { "displayMode": "list", "placement": "bottom" },
        "tooltip": { "mode": "multi", "sort": "desc" }
      },
      "targets": [{
        "expr": "kubernetes.pod_namespace:\"$namespace\" AND kubernetes.pod_name:$app* AND NOT log.http_user_agent:kube*\n| stats avg(log.request_time) avg_time, max(log.request_time) max_time",
        "legendFormat": "{{__name__}}",
        "queryType": "statsRange",
        "refId": "A"
      }]
    },
    {
      "collapsed": false,
      "gridPos": { "h": 1, "w": 24, "x": 0, "y": 44 },
      "title": "Raw Access Logs",
      "type": "row"
    },
    {
      "title": "Access Logs",
      "type": "logs",
      "datasource": { "type": "victoriametrics-logs-datasource", "uid": "YOUR_VICTORIALOGS_DATASOURCE_UID" },
      "gridPos": { "h": 12, "w": 24, "x": 0, "y": 45 },
      "options": {
        "dedupStrategy": "none",
        "enableLogDetails": true,
        "showLabels": true,
        "showTime": true,
        "sortOrder": "Descending",
        "wrapLogMessage": false
      },
      "targets": [{
        "expr": "kubernetes.pod_namespace:\"$namespace\" AND kubernetes.pod_name:$app*\n| sort by (_time)\n| limit 200",
        "queryType": "instant",
        "refId": "A"
      }]
    }
  ]
}Why is this solution GDPR-compliant?
Recommendation: Anonymize or truncate IP addresses in the logs if you want to eliminate any remaining legal grey areas. This can be done directly in the nginx configuration or through a VictoriaLogs retention policy.
| Criterion | SaaS Analytics (e.g. GA) | nginx + VictoriaLogs + Grafana |
|---|---|---|
| GDPR | Cookie banner + consent | No banner needed |
| Data Location | USA / third party | Own infrastructure |
| Cost | Often usage-based | Fixed costs (infrastructure) |
| Customization | Limited | Full control over queries |
| Performance Data | Limited | Response times, error rates |
| Bot Detection | Built-in | Via user agent filters |
| Real-Time | Minutes delay | Seconds |
Want to use this solution without operating the entire stack yourself? ayedo offers all components as a managed service:
The entire observability stack is operated, monitored and updated by ayedo. You focus on your application – we take care of the infrastructure.
Contact us for individual consultation.
ayedo operates Kubernetes-based infrastructure for organizations that value digital sovereignty, compliance and operational excellence. Learn more
Data is the most valuable asset of modern companies—and simultaneously their greatest regulatory …

The Kubernetes community has taken a crucial step towards improving transparency and traceability …

TL;DR Polycrate platform operations require clear architecture, open interfaces, and governance to …