Five Key Features of Portainer
Five Key Features of Portainer 1. Docker Environments 2. Access Control 3. CI/CD Capabilities 4. …
07.05.2023
In a complex IT landscape, monitoring and understanding application performance can become a real challenge. The open-source framework OpenTelemetry offers a unified solution for monitoring and observability, enabling developers and DevOps to gain comprehensive insights into their applications. This article guides you through the basics, shows you why OpenTelemetry is important, and helps you take the first steps towards implementing this versatile framework into your technology stack.

OpenTelemetry is an open standard framework specializing in the observability of software applications. It serves as an abstraction layer for your applications and tools that you use for monitoring, tracing, and logging. By utilizing standardized APIs and SDKs, OpenTelemetry enables the generation, collection, transformation, and export of data, simplifying the analysis of software performance. Essentially, OpenTelemetry allows developers and DevOps teams to gain a comprehensive overview of their application landscape without being tied to a specific observability tool.
Before OpenTelemetry came into existence, there were already various tools and standards focusing on telemetry. Two projects, in particular, were at the forefront of the developer community: OpenTracing and OpenCensus.
OpenTracing was originally designed as a universal API standard for distributed tracing. It allowed developers to monitor data flow and latency in their distributed applications.
On the other hand, OpenCensus, a project by Google, provided not only tracing but also metrics. It combined monitoring and tracing functionalities into a single tool.
The decision to merge these two projects and continue as OpenTelemetry was a logical step. By combining the strengths of both tools, a unified, more powerful standard for observability was created. This was an important step to reduce fragmentation in the telemetry space and offer developers a more flexible and comprehensive solution.
The use of OpenTelemetry spans a variety of application areas in modern software development and operations. A classic example is identifying performance bottlenecks in microservices architectures, where OpenTelemetry provides detailed traces that allow developers to identify and resolve the causes of latency issues.
In error analysis, OpenTelemetry allows for quick diagnosis during outages through its logging functions. This leads to more efficient error resolution and thus improved application availability.
Scaling is another important area. Here, OpenTelemetry enables better decision-making for application scaling behavior by collecting metrics. This allows resources to be optimally adjusted to save costs and maximize performance.
OpenTelemetry is also used in the DevSecOps context. By continuously monitoring and recording security events, anomalies and security incidents can be identified in real-time, significantly reducing response times to security threats.
These examples show how OpenTelemetry has become an indispensable tool in the software observability landscape through its diverse applications and adaptability to various use cases.
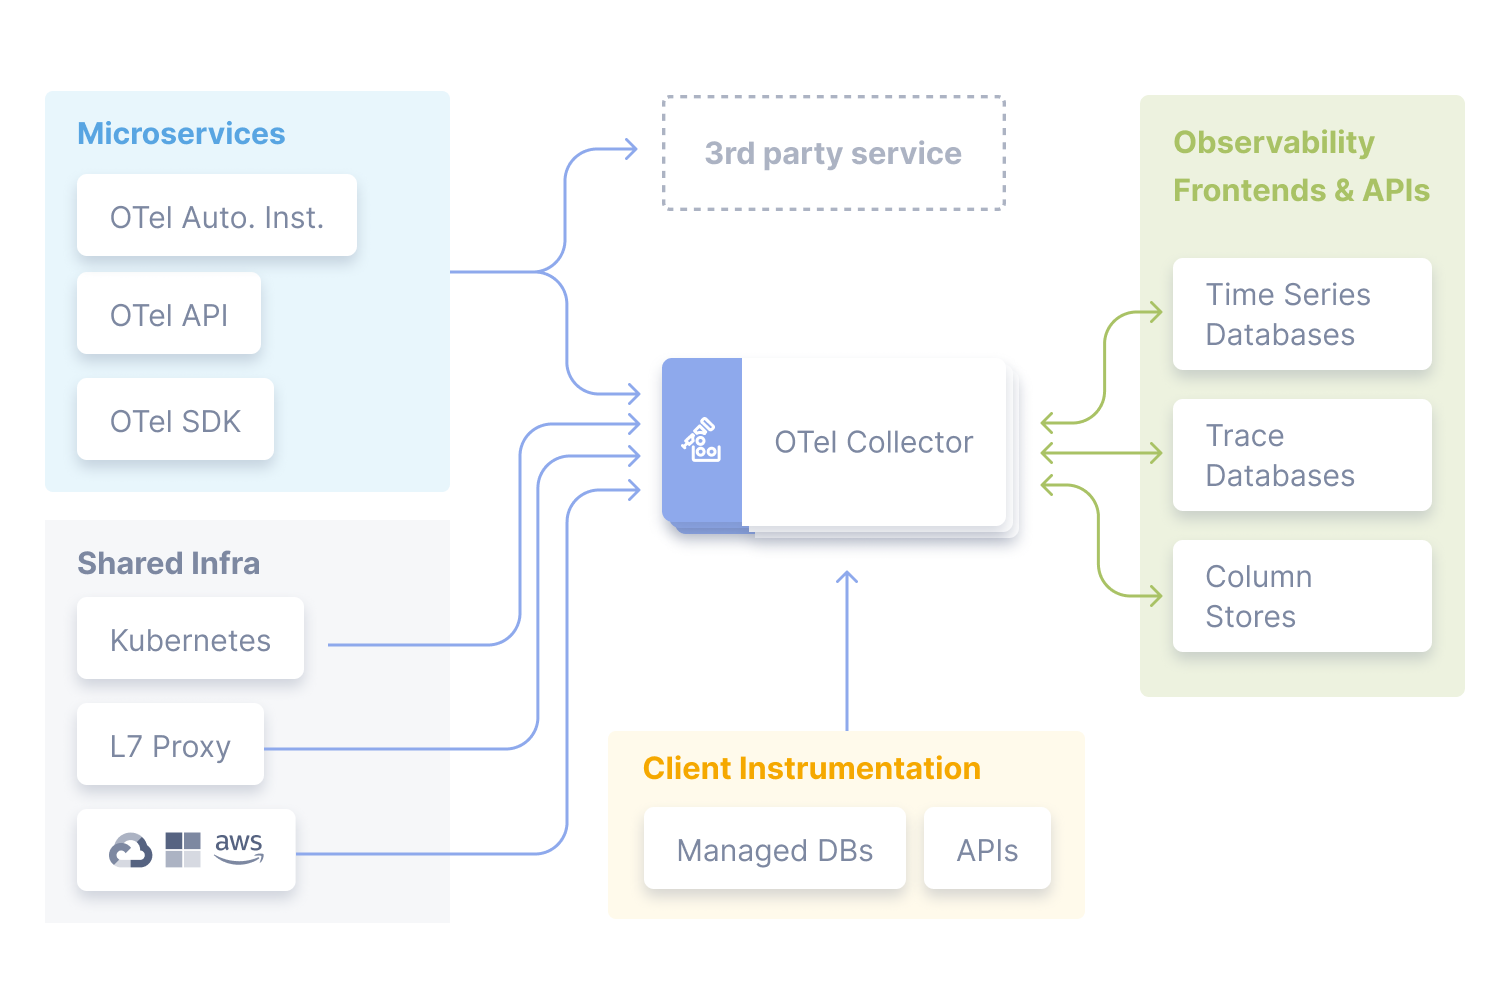
OpenTelemetry consists of several interlocking components. The basic building blocks include:
These components work together to create a flexible and powerful environment for telemetry data collection and analysis, which is essential for modern cloud-native applications.
 https://opentelemetry.io/docs/
Data collection in OpenTelemetry is an automated process enabled by instrumenting the application codebase. Developers can manually add instrumentation code or use automatic instrumentation through existing libraries. Once instrumentation is in place, the OpenTelemetry APIs begin collecting telemetry data such as traces, metrics, and logs.
  <div class="text-sm leading-relaxed text-gray-700 dark:text-gray-300">
    <ul>
Traces: Traces are records that trace the journey of a request through various parts of a system or multiple services. They provide precise information about operations and interactions within the infrastructure. This includes data on request duration, the path a request takes, and delays occurring at individual points. This allows complex processes to be understood and potential bottlenecks or sources of error to be identified. Traces are thus a central component of performance analysis and provide insights that enable targeted optimization of applications.
Metrics: Metrics are quantitative measurements that reflect essential aspects of system performance and health. They encompass a variety of data points, including workload, throughput, response times, and memory consumption. These measurements help identify trends, plan capacities, and ensure system reliability. Metrics are essential for maintaining high performance standards and form the basis for scalable and resiliently operating applications.
Logs: Logs are detailed records of events occurring during the runtime of applications. They provide context-rich information about errors, warnings, and other important events. By analyzing log data, developers and operations teams can gain deeper insights into application behavior and quickly diagnose and resolve emerging issues. Logs are thus an invaluable resource for debugging and maintaining applications and significantly contribute to ensuring the integrity and stability of IT systems.
  </div>
</div>
These data are then initially processed by the SDK, which applies rules for data aggregation, filtering, and batching before the data is forwarded to the appropriate exporters. The exporters then send the processed data to the observability platforms, where they can be used for analysis and monitoring. The OpenTelemetry Collector can act as a central data collector and distributor, gathering data from various SDKs, transforming it, and transmitting it to the final target platforms.
By using OpenTelemetry and the associated use of a unified observability platform, cost efficiency is enhanced as separate monitoring tools become redundant. Companies benefit from the reduction of redundant systems and processes, which in turn lowers operating costs. By standardizing telemetry data across different applications and infrastructures, OpenTelemetry enables a consolidated view, reducing the need for multiple licenses and the management of various toolsets. Additionally, efficient data usage and processing allows for more precise resource allocation, avoiding unnecessary expenses.
Scalability is one of the core advantages of OpenTelemetry. It supports dynamic infrastructures and modern applications that constantly evolve and change. With OpenTelemetry, developers and ops teams can monitor their applications’ performance in real-time and capture metrics necessary for proper scaling. As it seamlessly integrates into existing and new systems, it can keep pace with the company’s growth without the need to constantly evaluate and implement new tools. The support for a wide range of programming languages and frameworks also ensures that teams can maintain observability practices regardless of technology choice.
Moreover, OpenTelemetry improves application performance through detailed insights into their behavior. It enables in-depth analysis of transactions and processes, leading to faster identification and resolution of performance issues. By precisely monitoring applications, OpenTelemetry allows for optimization opportunities to be identified and fully exploited. This not only contributes to an improved user experience but also helps strengthen brand reputation and increase customer satisfaction. Furthermore, OpenTelemetry supports the monitoring of cloud-native applications, promoting strong performance in distributed systems.
In conclusion, OpenTelemetry is a clear and efficient solution for companies facing the challenge of optimizing their IT systems while maintaining a clear overview of their application landscape. It is a powerful tool that not only eases the daily work of developers and IT professionals but also creates real value for the entire company. With an emphasis on cost efficiency, scalability, enhanced performance, and monitoring capabilities, OpenTelemetry addresses the key challenges of modern IT landscapes.
Five Key Features of Portainer 1. Docker Environments 2. Access Control 3. CI/CD Capabilities 4. …
Polycrate API 0.11.27 is a major feature release focusing on K8sApp pod status tracking, DataSource …

With Polycrate API 0.11.17, we enhance the diagnostic capabilities for the timeline charts in the …