AWS CloudWatch & Azure Monitor vs. APM Stack (Considering Your Observability Needs)
Considering Real Observability Needs Observability determines how well systems can be understood, …
21.01.2026

Monitoring and Observability have long surpassed being mere operational tools. They determine how systems are understood, evaluated, and managed. AWS CloudWatch and Azure Monitor are the native monitoring and observability services of their respective hyperscalers. Grafana takes a fundamentally different approach.
The difference is not in whether metrics, logs, or events are captured. It lies in who defines how this data is structured, correlated, and utilized. Monitoring is thus not purely a technical question—it is a matter of architectural sovereignty.
CloudWatch and Azure Monitor are deeply integrated into their respective cloud platforms. They automatically capture metrics, logs, and events from compute, network, and platform services. Dashboards, alerting, and simple correlations are immediately available. The onboarding is straightforward, and the operational entry is low.
Here, monitoring is not a standalone architectural component but part of the cloud offering. When resources are provisioned, observability is included. For many teams, this is attractive: minimal setup, clear defaults, quick results.
However, this simplicity is bound to a clear framework.
CloudWatch and Azure Monitor follow proprietary data models, query languages, and retention logics. What is measured, how it is aggregated, and at what cost is decided by the provider. Logs, metrics, and alarms are technically usable but conceptually tailored to the respective cloud.
Kubernetes, hybrid setups, or additional data sources can be integrated—but always within the limits of the respective service. Queries follow cloud-specific languages, retention is cost-driven, and correlations are oriented towards the provider’s logic.
Here, observability is consumed, not designed. It optimizes the view of a single cloud—not a cross-platform architecture.
Grafana starts from a different point. As an open-source platform for visualization and observability, Grafana is not a data store but a unified analysis and presentation layer across many data sources.
Metrics from Prometheus or VictoriaMetrics, logs from Loki or VictoriaLogs, traces from Tempo or Jaeger—Grafana correlates this data regardless of where it originates or is stored. The platform logic does not lie with the infrastructure provider but within one’s own observability architecture.
Thus, Grafana is not a cloud service but a connecting element.
The crucial difference lies in the role the tool assumes. CloudWatch and Azure Monitor couple observability to the cloud. Grafana decouples analysis and visualization from the infrastructure.
Dashboards, alerts, and SLOs can be consistently defined across multiple clusters, clouds, or data centers. Kubernetes is not treated as an exception but as a first-class citizen. Observability follows the application and the platform—not the provider it currently runs on.
Especially in distributed systems, this is not a nice-to-have but a prerequisite for reliable operational models.
This openness fits modern platform approaches. Grafana integrates seamlessly into Kubernetes environments, supports declarative configurations, and can be operated in a GitOps-compliant manner. Dashboards, alerts, and SLO definitions are versionable, reproducible, and portable.
The same observability layer works on-premises, in a European cloud, or distributed across multiple providers—without rebuilding visualization or alerting. The platform maintains its view of the system, even if the infrastructure changes.
This is not possible with hyperscaler monitoring because it is not designed for it.
The price for this independence is conscious design. Grafana does not make decisions about data collection or storage. Data sources must be selected, operated, and scaled. Retention, aggregation, and costs are one’s own responsibility.
In return, transparency is created. Costs are comprehensible, data flows are clear, dependencies are visible. Observability becomes manageable—not limited by pricing models or implicit limits.
Optimization here means better architecture, not higher service tiers.
In platforms with a claim to technological sovereignty, the difference becomes clear. Hyperscaler monitoring optimizes the view of a single cloud. Grafana establishes a unified, open observability layer across all environments.
The connection to OpenTelemetry, Kubernetes, and open-source data sources makes Grafana compatible with long-term platform strategies—independent of how infrastructure or providers develop.
| Aspect | CloudWatch / Azure Monitor | Grafana |
|---|---|---|
| Role | Cloud Function | Observability Layer |
| Data Model | Proprietary | Open |
| Platform Binding | High | Low |
| Kubernetes Focus | Complementary | Native |
| Portability | Low | High |
| Design Sovereignty | Provider | Operator |
CloudWatch / Azure Monitor are sensible for:
Grafana is sensible for:
Monitoring not only decides whether systems are “green”. It decides who defines how systems are understood, evaluated, and managed.
CloudWatch and Azure Monitor subordinate observability to the cloud. Grafana makes it an open, controllable platform layer.
The difference is not functional but strategic. Those who consume observability adopt the provider’s view. Those who design it themselves retain their own perspective—even when infrastructure, cloud, or organization changes.
Considering Real Observability Needs Observability determines how well systems can be understood, …

Anyone managing modern Cloud-Native infrastructures knows the problem: data is everywhere, but …
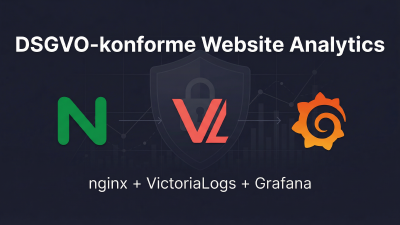
TL;DR Google Analytics, Matomo Cloud and other SaaS tracking tools are problematic from a GDPR …